
11 Most “Wicked Awesome” Education Infographics I’ve Seen Lately
Who doesn’t love a good infographic? They’ve become my favorite way to ingest statistics (not that I necessarily always believe the numbers). And there seems to be more and more captivating infographics out there all the time in the Education sector.
Here in New England, something surpassingly excellent is often deemed “wicked awesome!” So with apologies to the grammarians out there, here are ten fresh education infographics that in my humble opinion rate “wicked awesome” status. Enjoy!
#1: How is technology impacting education? (From sodahead.com)

#2: Best iOS Apps for Mobile Learning (from OnlineUniversities.com)

#3: Best college and university websites (from bestedsites.com)

#4: What does it take to create effective e-learning? (From leanforward.com)

#5: The 7 best places for online education (from OnlineUniversities.com)

#6: Graduating with Technology (from LearnStuff.com)

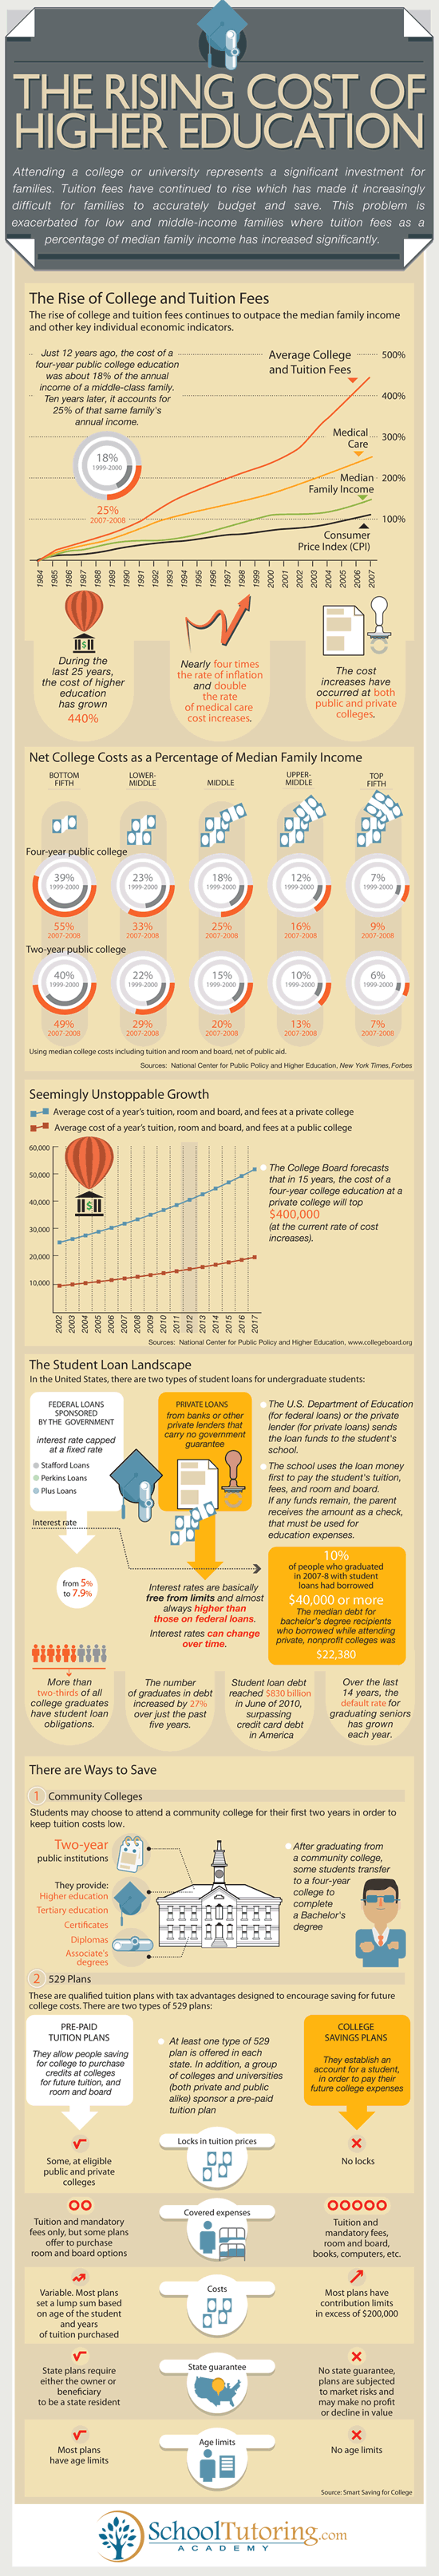
#7: The rising cost of higher education
#8: Percentage of students who said virtual education had a positive impact (from Project Tomorrow in edweek.org)

#9: Mobile Learning Report Card (from TMobile)

#10: Six Emerging Technologies in Education (from Saint Xavier University)

#11: The 10 most popular college majors for men and women (from bachelorsdegreeonline.com)

Great sources of education infographics out there in the blogosphere:
- http://edudemic.com/2012/08/best-infographics/
- http://issuu.com/medkh9/docs/21awesomeeducationalinfographics
- http://www.webdesignerdepot.com/2011/12/infographic-the-best-education-websites-by-the-numbers/
- http://edtechtimes.com/2012/10/29/the-7-best-places-for-online-education-infographic/
- http://pinterest.com/twahlert/educational-infographics/
- http://www.coolinfographics.com/blog/tag/education
Featured image courtesy of jrsnchzhrs.
SAT vs ACT: Choosing the Right Test [NEW EBOOK]

Download this free 20-Page Ebook for Tutors Now!
Our free 20-page ebook is a step-by-step guide on how to select the right test for your student. Learn everything you need to know about using the PLAN and PSAT to improve student scores, how to leverage learning analytics to select one test over the other, and other tips on how to take the guesswork out of selecting the ACT vs the SAT.


