Imagine 2 people have learned to make a birdhouse in two different states from a different instructor.
After they take the birdhouse-builder’s standardized test, we line up the birdhouses and take a look. According to the birdhouse building manual for Massachusetts, which is where the builder is from, one birdhouses is missing a few key items which make a birdhouse well-rounded. Thusly, we must declare the builder to be insufficiently prepared for the next phase of birdhouse making. Oddly enough, the birdhouse by the second individual is almost exactly identical to the birdhouse made from the builder in Massachusetts, except for one thing. A person in Tennessee built it.
Though one would argue that both parties are insufficiently prepared to move onto the next phase of birdhouse making, you”re forgetting one crucial fact. The builder of the second birdhouse is from the state of Tennessee which means that according to the state benchmarks for birdhouse making, the individual who build this birdhouse is a proficient bird house builder for his grade level.
Study Finds Testing Cut-offs Vary Dramatically State by State
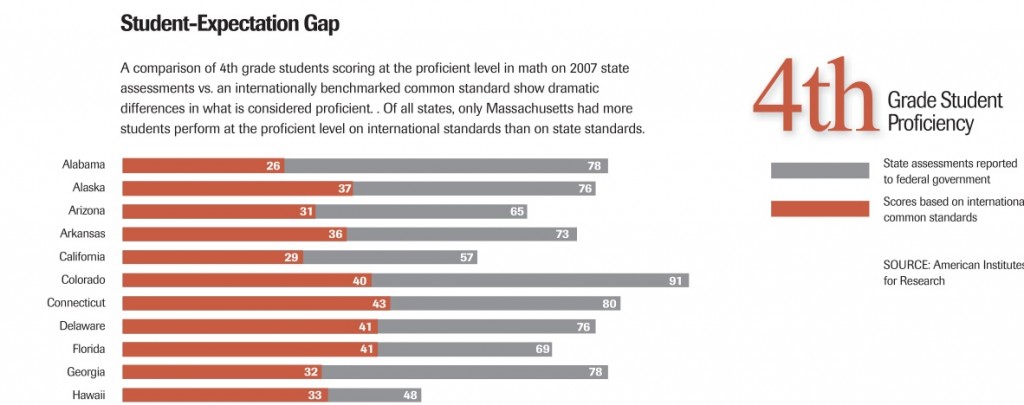
The story above may seem like a farce from Catch-22, but there is nothing funny about a recent study from the American Institute of Research which shows that when you measure a state’s learning benchmarks for reading, science and math state by state, results can vary dramatically.
(To view in full size, download from the American Institute for Research in PDF form)
Admittedly, the differences between state benchmarks are even worse when you then compare them with the international standard, as that the learning gap between other countries and a US state can be up to four grade levels wide. That’s double the size of the National Assessment of Educational Progress’s 2007 findings on the achievement gap between black and white students.
Though shocking, the American Institute of Research hopes this information will help support their case for states to remain competitive world-wide by requiring all states to incorporate external benchmarks as a guide to defining the national standard (which the report calls the “Benchmark Standard”)
Building Better Benchmarks
In Spring 2010, three states took the first step toward setting better proficiency bars for students by slipping some questions from the PISA, an international standardized test which measures the proficiency of 15-year old students, into a high school level math assessment. Though the questions aren’t counted against the students scores, participating states can use this data to set reliable, competitive benchmarks for US students nationwide.
featured image by number657
What are you and your school doing to incorporate better learning benchmarks into your curriculum?
6 Digital Trends to Watch In Education
A detailed review of the latest internet trends such as social media, video, game based-learning impacting education and how educators, teachers and tutors can embrace those changes with the rise of the digital- native.


One Response to "Warning: Learning Expectations Can Vary Dramatically by State"