
Data Analysis Made Simple: Interpreting SAT Graphs and Charts
One of the SAT’s biggest goals is to measure students’ abilities for future success.
For this reason, the SAT doesn’t just test content you’ve learned in high school. It also tests what you need to succeed in college, such as critical thinking skills and logical reasoning.
The SAT, for example, incorporates many charts and graphs questions that challenge students to interpret data on their own. In fact, charts and graphs appear on all sections of the test!
Such graphs might look overwhelming at first, particularly for students who haven’t done much data analysis in high school. But these questions are much easier if you know exactly what the SAT is looking for.
Reading SAT Graphs Successfully
The new Digital SAT Math includes a significant number of charts and graphs questions. These questions often include a figure and require students to perform basic data analysis.
Types of SAT Math Charts and Graphs Questions
It’s worth noting that students shouldn’t expect to see an even distribution of graphs/charts throughout the math section.
What kinds of charts and graphs appear on SAT Math?
Students can expect to see problems involving:
- Scatterplots
- Bar Graphs/Histograms
- Line Charts
- Two-Way Tables
Scatterplots on SAT Math
Let’s look at an example of a question involving a scatterplot:
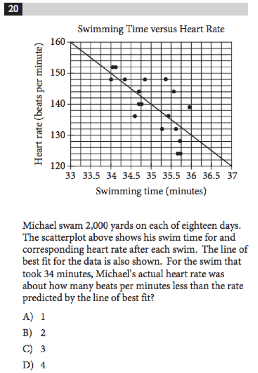
How to solve:
We can see that at 34 minutes, Michael’s actual recorded heart rate was 148 BPM, and the line of best fit predicts a heart rate of 150 BPM. The difference, therefore, is 2, or answer choice B.
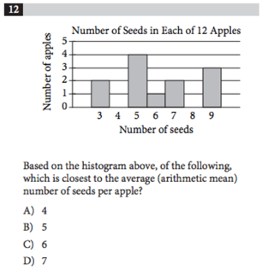
Bar Graphs / Histograms
When approaching a bar graph, be sure to pay attention to the following:
- The title of the graph, which will identify the type of data set
- The variable(s) listed along the x-axis
- The frequencies measured along the y-axis
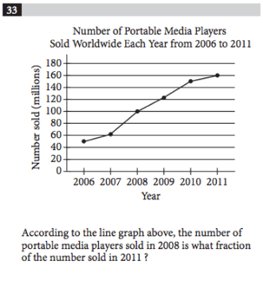
Line Graphs on SAT Math
In the case of line graphs:
- The x-axis will list the independent variable
- The y-axis will list the dependent variable
Two-Way Tables
When analyzing a two-way table on the SAT, pay attention to the following:
- The titles of the column(s)
- The titles of the row(s)
- Rows or columns that specify total values
Next Steps
The Digital SAT Math section is very interested in students’ ability to analyze data.
With charts and graphs questions on the math section, it’s always vital to spend time with the figure or chart first. This will minimize the possibility of falling for a trap answer!


